· Nordic · 5 min read
Visual Studio Code and Cortex-Debug extension for nRF52
Debugging nRF52 applications doesn't have to be complex. With Visual Studio Code (VS Code) and the Cortex-Debug extension, you can set up a streamlined development environment for Nordic Semiconductor’s nRF52 series with ease. In this guide, we'll walk you through configuring VS Code for nRF52 development, installing the necessary extensions, and setting up the Cortex-Debug plugin for smooth debugging. Whether you're just starting or looking to enhance your workflow, this tutorial will help you get up and running quickly with powerful debugging capabilities, right from within your favorite code editor.
Introduction
In previous article, we discussed about debugging nRF52 firmware by printing out messages to console using NRF_LOG module. Although very useful, debugging using NRF_LOG sometimes does not work, simply because the program may halt somewhere and log messages are not printed out. In those cases, you may want a more powerful debugging tool that allows you to step over each line of code manually. In this article, I will show you steps to set up Visual Studio Code and Cortex-Debug extension for that purpose. You will learn how to install required tools, setup a project, create a debug configuration and debug your nRF52 projects.
Prerequisites
Before diving into our main topic of debugging using Cortex-Debug extension, it is important that you know how to setup a proper project for nRF52 development. We have a dedicated article for that which you might want to check out before proceeding with this guide. As a reminder, you will need to install nRF5 SDK, GCC ARM Embedded Toolchain, nRF Command Line Tools, make and Visual Studio Code. The steps to install those tools are not covered in this post.
Since we are debugging code, you also need a nRF52 board to follow along. If you are using a nRF52 development kit, such as PCA10040, all you need is a USB cable to plug in to your development host (your computer). On nRF52 kits, there are debugging interface already implemented for you and simplify the setup. If you are using your custom nRF52 board, you’ll need a debugging probe, such as a JLink Lite Cortex M debugger. Such probe allows you to flash program/control the nRF52 chip via SWD interface.
You can also use other nRF52 development kits such as
Affiliate Disclosure: When you click on links in this section and make a purchase, this may result in this site earning a commission at no extra cost to you.
Cortex-Debug extension
If you have been using Visual Studio Code, you probably know about what an extension is. Extensions are programs that are developed by third-party developers and can extend the functionalities of VSCode text editor. You find extensions by searching for their names on VSCode marketplace. To debug nRF52 applications, we will be using a popular extension named Cortex-Debug. This is a highly rated extension for debugging ARM Cortex-M chips in general. Since nRF52 has a Cortex-M core, the extension is also capable of debugging nRF52 chips.
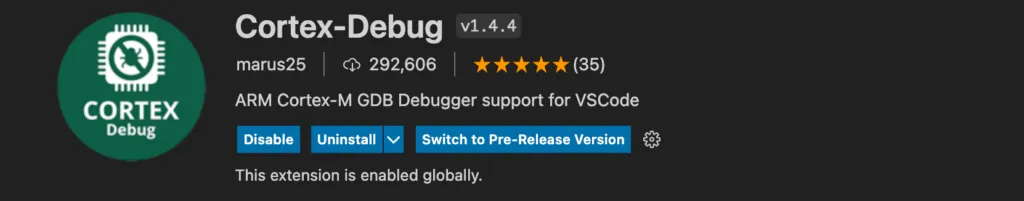
Installing the extension is trivial, as you just need to type ‘Cortex-Debug’ and click Install button. Here’s what you see after successfully installing the extension
Debugging with Cortex-Debug
Now let’s create a new project for debugging. For demonstration purpose, we will take an example from SDK nRF5_SDK_17.1.0_ddde560/examples/peripheral/blinky. Create a new folder at ~/nrf52/projects/blinky and copy the following files to it
main.cblinky_gcc_nrf52.ldMakefilesdk_config.h
Make the following changes to Makefile:
- Change
SDK_ROOTandPROJ_DIRto point to the SDK folder and current folder, respectively - Delete the line
../config \inINC_FOLDERS
With those modifications, open a terminal and type make. You should see the log messages printed on the console and confirm compilation is successful. If you type make flash, the program will be flashed to the target chip and you should see LEDs on the nRF52 development kit blinks.
Create a debug configuration
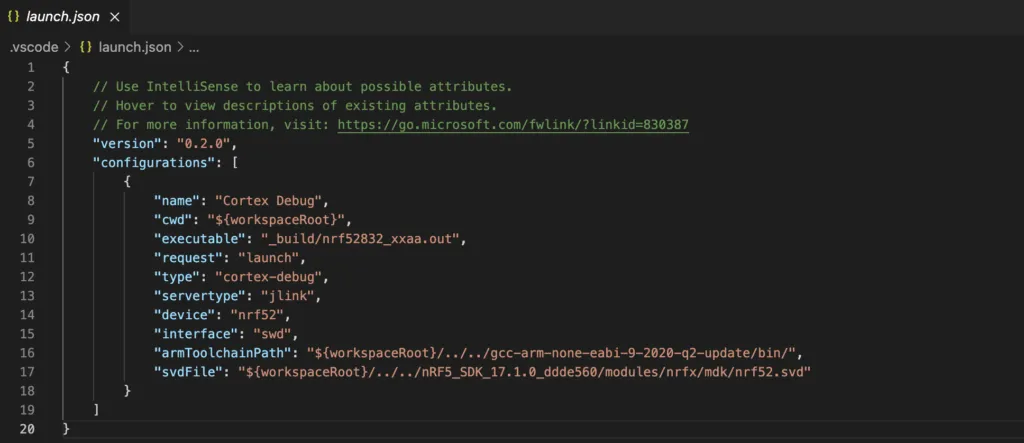
To create a debug configuration, click the Run and Debug icon on the left hand side of VSCode, then click Create a launch.json file and select Cortex-Debug in the dropdown menu. The launch.json file will be created in .vscode folder. It contains configurations for debugging. You need to make a few modifications in order to be able to run debugging:
- Change the value for
executable: this should be the file in your_buildfolder,nrf52832_xxaa.out - Add
"device":"nrf52"to specify nrf52 family - Specify the interface SWD for JLink debugger
"interface":"swd" - Add ARM toolchain path
"armToolchainPathwhich points to the GCC ARM folder you downloaded earlier - Specify the location of
"svdFile"in nRF5 SDK so that it can load peripherals and registers values.
The final configuration of launch.json looks like this:
Sample project with vscode configuration can be seen on Github.
Run debugging
Now you can start debugging your application by clicking the small green triangle icon on the top left corner. A debugging interface that looks like the image below will be displayed
 nRF52 debug interface with Cortex-Debug extension
From here, it allows you to do normal debugging steps such as:
- Set a break point: if you click on the left of a line in your source code file, a red circle will show up indicating a break point is set at that line. On the Breakpoints section in the panel on the left hand side, there is also an indication which line of which file breakpoints are set.
- Start, Resume, Stop, Restart execution: there are buttons on the control bar on the top that allow you to perform these operations.
- Step Over, Step In, Step Out: These options are in the same control bar on the top, indicated by arrows.
- You an inspect variables, callstack, peripheral registers and cortex registers on the left panel
Wrapping Up
Debugging is essential when developing a firmware application, hence it is worth to spend some time to set it up properly. With the help of Cortex-Debug extension, you can make VSCode as a powerful nRF52 integrated development environment.